
Original Record Source.
View the original record authored by ‘Dainet Sierra’ at ‘METEORED (Your Weather)’ via recovered Helion Archive database link:
Climate change’s blind spots: Regions with little to no data are raising concerns among scientists
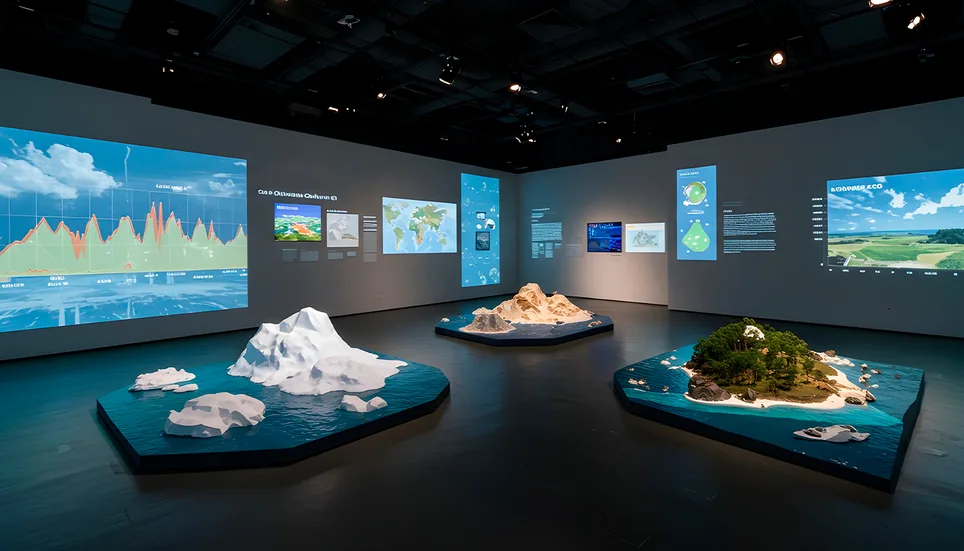
Billions of people around the world live in places and circumstances that make them highly vulnerable to the effects of climate change. This includes regions of Africa, Asia, and small Pacific islands, where data visualization is an essential tool for communicating climate change.
Warming trends are represented through colors, emissions through lines and bars, and floods and wildfires through maps and animations. These visualization tools can make an enormous and highly complex issue easier to understand and can also influence how people perceive it. However, some visualizations do not tell the whole story.
Data visualization can change people’s perceptions
A recent study involving 34 social media users from the United Kingdom and Poland explored how people responded to climate data visualizations. Participants were shown visualizations and then asked how they felt, how they reacted to the information, and what actions they took. They described feelings of concern, fear, sadness, anger, and unease, but also curiosity, surprise, and enjoyment, suggesting that data visualization …….
 English